Data Visualization Platform V2 – User-Friendly Tool for Businesses of All Sizes: A Case Study
A large retailer in the United States wanted to create a generic data visualization platform that could be used by their various business units. The platform needed to be able to query different databases using the same queries, and it needed to allow users to create, manage, and share data visualizations.Data Visualization Platform V2 – User-Friendly Tool for Businesses of All Sizes: A Case Study
A large retailer in the United States wanted to create a generic data visualization platform that their various business units could use. The platform needed to be able to query different databases using the same queries, and it needed to allow users to create, manage, and share data visualizations.
The retailer approached HDWEBSOFT, a leading software development company, to help them build the platform. HDWEBSOFT has a proven track record of delivering high-quality software solutions to businesses of all sizes.
HDWEBSOFT built the data visualization platform using modern technologies like Vue.js, Node.js, and ElasticSearch. The platform is user-friendly and can be customized to meet the specific needs of each business unit.
The data visualization platform has been a success for the retailer. The platform has helped the retailer to improve its decision-making process and to gain a better understanding of its customers. The platform has also been used to create reports and dashboards shared with the retailer’s executive team.
This case study demonstrates how HDWEBSOFT can help businesses of all sizes build innovative software solutions that meet their specific needs.
Here are some additional details about the project:
Features
The data visualization platform includes the following features:
- Data source bridge: This bridge allows users to query different databases using the same queries. This makes accessing and analyzing data from various sources easy for users.
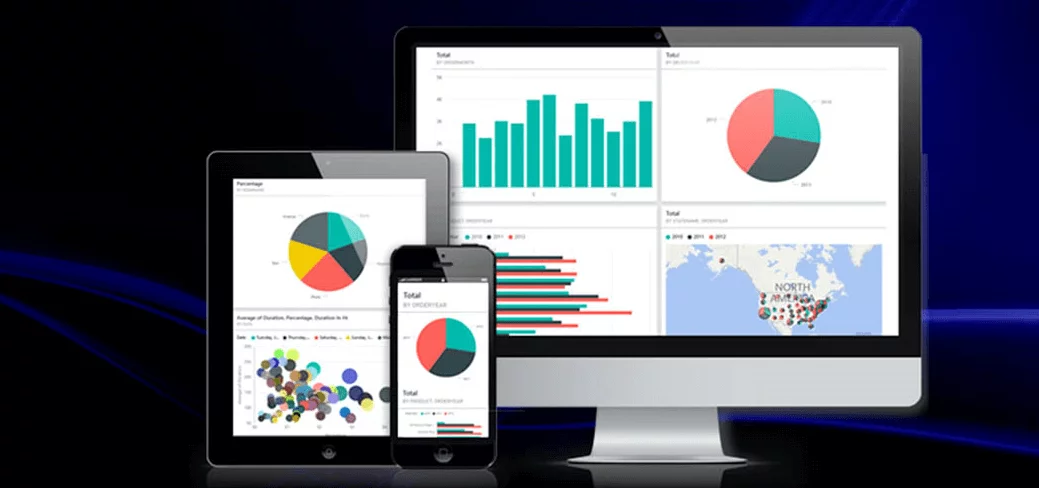
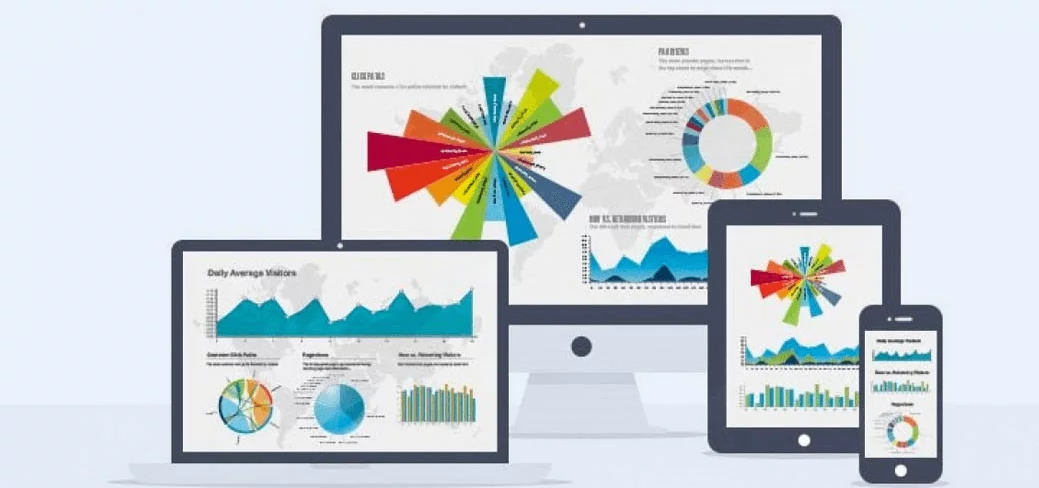
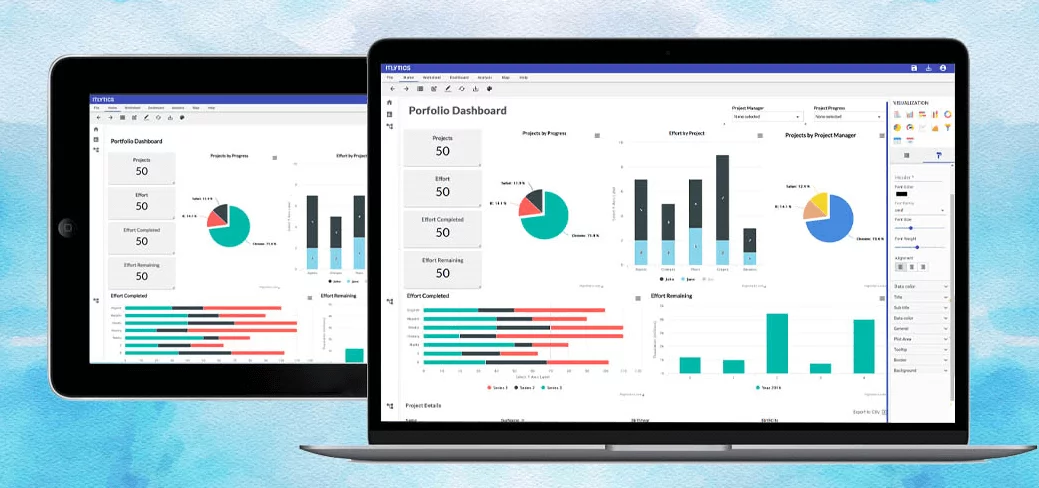
- Visualization builder: This tool allows users to create different visualizations from a data source. Users can choose from a variety of chart and graph types, and they can customize the look and feel of their visualizations.
- Visualization management: This tool allows users to manage their saved visualizations. Users can create folders to organize their visualizations and share visualizations with others.
- Dashboard builder: This tool allows users to build dashboards from the managed visualizations. Dashboards can be used to display multiple visualizations in a single view, and they can be customized to meet the specific needs of each user.
Challenges
The development of the data visualization platform faced several challenges, including:
- Using modern technologies: The platform was built using technologies like Vue.js, Node.js, and ElasticSearch. These technologies are powerful, but they can be complex to use.
- Supporting multiple databases: The platform is needed to support various databases. This required the development of a robust data source bridge.
- Creating a user-friendly interface: The platform needed to be user-friendly so that users of all skill levels could use it.
Solutions
The following solutions addressed the challenges described above:
- A trade-off between complex UI and jQuery, HighCharts, and Vue.js capacity: The platform was designed to focus on usability. However, the team also wanted to leverage the power of Vue.js to create a more sophisticated user interface. The team made a trade-off between complexity and usability to achieve this balance.
- The excellent code structure of Vue.js: The team created a good code structure for Vue.js. This made it easier to maintain the code and to add new features in the future. Let’s learn more about HDWEBSOFT Vue Development Services.
- Analyzing database queries and making solution decisions by keeping them balanced in feature, performance, and maintenance: The team analyzed the various database queries required for the platform. They ensured that the queries were balanced regarding features, performance, and maintenance.
- Deploying the platform on Google Cloud Platform Kubernetes Engine: The team deployed the platform on Google Cloud Platform Kubernetes Engine. This made it easy to scale the platform up or down as needed, and it also made it easy to maintain the platform. Learn more about DevOps Services.
- Using Atlas MongoDB: The team used Atlas MongoDB as the data store for the platform. Atlas MongoDB is a fully managed, cloud-based database service that provides a scalable, reliable, and secure platform for storing and managing data.
- Node.js with Hapi framework: The team used Node.js with the Hapi framework to build the platform’s back end. Hapi is a powerful and flexible framework that makes it easy to build scalable and reliable web applications. Learn more about our Node Development.
- Python Django: The team used Python Django to build the platform’s front end. Django is a mature and well-tested framework that makes building user-friendly and efficient web applications easy. Learn more about our Python Development.
- ElasticSearch: ElasticSearch is a search engine that indexes and searches large amounts of data. More than that, its aggregation capabilities are impressive. The team used ElasticSearch to index the data from very large-sized data sources. This made it easy to search and analyze the data.
Business outcomes
The data visualization platform v2 has had several positive business outcomes for the client:
- High reusability: The platform is designed to be highly reusable, which means it can be used by all of the client’s software applications. This has saved the client time and money, as they no longer need to develop and maintain separate data visualization tools for each application.
- Cost saving with microservices: The platform is built using the fundamentals of microservice, a software architecture that breaks down an extensive application into smaller and independent services. This makes the platform more scalable and flexible, and it also helps to reduce costs.
- Automated data synchronization: The platform automatically synchronizes data from different sources, which eliminates the need for manual data entry. This has saved the client time and money and improved their data accuracy.
Overall, the data visualization platform v2 has been a valuable tool for the client. The platform has helped them to save time and money, and it has also improved the accuracy of their data.
Conclusion
The data visualization platform v2 project was a success. The platform helped the retailer to improve its decision-making process and to gain a better understanding of its customers. The platform was also easy to use and could be customized to meet the specific needs of each business unit.
The team successfully deployed the platform on Google Cloud Kubernetes Engine and used Atlas MongoDB as the data store. This made it easy to scale the platform up or down as needed, and it also made it easy to maintain the platform.
The data visualization platform v2 project demonstrates HDWEBSOFT’s ability to consult with clients to find the best combination of technologies to meet their specific needs. If you want to learn more about the data visualization platform v2, please get in touch with HDWEBSOFT. We would be happy to discuss your specific needs and how we can help you build a custom data visualization platform that meets your requirements.
Learn more about our Platform Development.
Category
All, BI, Big Data, Data Hub, ElasticSearch, Express, GCP, Hapi, jQuery, Large-Scale, MongoDB, MySQL, Node.js, Platform, Platforms, Python, Visualization, Vue.js, Web Apps


